As we approach midterm elections in November, here is some investment research from Capital Group that I think is very relevant during this season. History tells us that investing based off our own political beliefs may not be a prudent strategy. AKA Red vs. Blue isn’t an accurate indicator of good or bad stock markets, believe it or not. However, midterm elections which occur every 4 years, have produced a theme that may give you some hope.
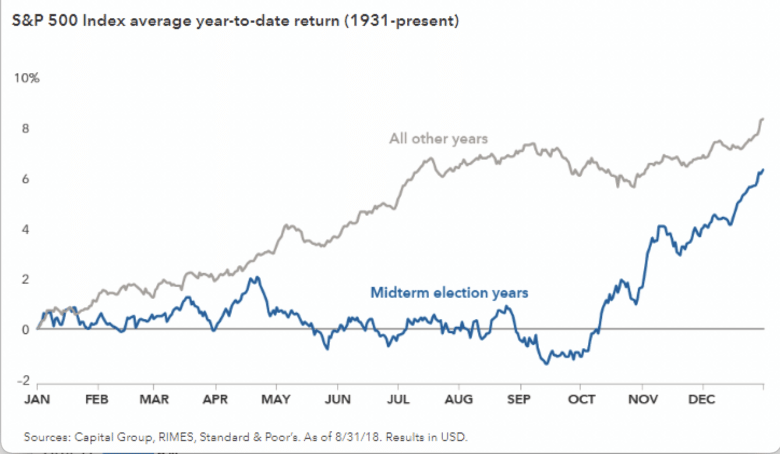
Since 1931, the average return of the stock market (S&P 500) in midterm election calendar years Is lower than non-midterm election years. More importantly, the average calendar year return from January – October in those midterm election years is actually negative (like this year!). Pretty compelling data considering it spans 22 midterm election cycles over the last 91 years.
Below is a chart to illustrate:
Market Returns Tend to be Muted Until Late in Midterm Years
Since markets rise over long periods of time, it makes sense that a price chart of an “average” year would also steadily increase. However, isolating just the years that midterm elections were held shows that investors treat these periods differently than others. In these instances, markets tend to oscillate for most of the year, gaining little ground until shortly before the elections.
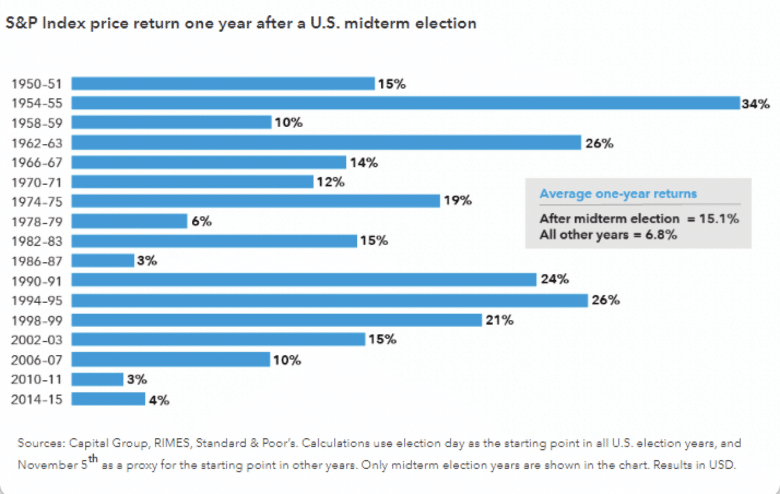
The positive news is that once midterm elections occur, returns over the following 12 months are more than double the average for all other years at 15%.
See the chart below:
More Often Than Not, Markets Bounce Back Strongly After U.S. Elections Are Over.
The silver lining for investors is that after these bouts of volatility, markets tend to rebound strongly in subsequent months. As we saw in the earlier chart, markets typically rally shortly after midterm elections. History shows that this isn’t usually a short term blip either, as above-average returns are typical for the full year following the election cycle. Since 1950, the average 1-year return following a midterm election is 15.1%, more than double that of all other years during a similar period.

WHY IS THIS?
Personally, I believe it’s because markets and investors like certainty. Markets fear the unknown. This investing theme is similar throughout US history: COVID in March 2020, financial crisis of 2009, 9/11 terrorist attack in 2001, JFK assassination in 1963, Cuban Missile Crisis in 1962, etc. Once the election results are known, whether “good” or “bad,” there is now a direction and agenda, and investors/professionals react to it.
Below is the link to the entire article from Capital Group. The article was written in September 2018. It’s funny because that year’s midterm election ended up providing the same theme with a 12% return (S&P 500) the 12 months following November 6th, 2018.
If you’d like to talk further about this research or if you have any questions, the Stansell Wealth Team is here to serve you.


